
Your biggest fan base lives outside the stadium.
For every fan in a seat, there are hundreds watching from home, following on social, buying merch online, and waiting for a reason to feel closer to the team. accesso Intelligence unifies every fan interaction, whether it happens inside the venue or across the digital ecosystem, and turns that data into revenue, retention, and loyalty that compounds season over season.

You know everything about the 20,000 fans in the building. You know almost nothing about the 2 million who care.
Sports organizations have deep data on ticket holders: what they buy at the concourse, when they arrive, where they sit. But the vast majority of a team's fan base never walks through the gates in a given season. They stream games, follow on social media, buy jerseys online, and engage with the brand every single day. That fan graph is fragmented across a dozen platforms, and most of it never connects back to revenue strategy. The result: loyalty programs that reward transactions instead of fandom, pricing that ignores demand signals from digital engagement, and a merchandise and sponsorship operation that cannot see the full picture.
The fan graph is fragmented
Ticketing, merch, F&B, streaming, social, app usage, and email all live in separate systems. No single view of who a fan is, how engaged they are, or what they are worth across every touchpoint.
Loyalty rewards transactions, not fandom
Most sports loyalty programs only see purchases. A fan who watches every game, shares content daily, and influences ten friends to buy tickets gets nothing until they scan a credit card.
Revenue peaks and valleys by season
Gameday revenue spikes but the off-season goes quiet. Digital merch, content monetization, and year-round engagement represent an enormous revenue opportunity that most organizations barely tap.
Sponsorship sold on impressions, not outcomes
Sponsors want proof of engagement and attribution. Without a unified fan view, sponsorship packages are priced on estimated eyeballs rather than measured fan interactions and purchase behavior.
Ask about any fan segment. In the stadium or a thousand miles away.
accesso Intelligence connects ticketing, merchandise, concessions, streaming, social engagement, app usage, and loyalty data into a single fan graph. Then it lets you ask questions no single system could answer on its own.
On gameday, Intelligence operates in real-time: concourse flow, concession demand, dynamic pricing triggers, and in-seat engagement. Between games, it shifts to fan intelligence: segmentation, churn prediction, campaign optimization, and revenue modeling across every fan touchpoint, physical and digital.
Intelligence for every fan, everywhere
From the suite level to the living room. From single-game buyers to lifelong season ticket holders. From the merch store to the streaming app.
Fan Intelligence and Segmentation
Build a unified fan graph that connects every interaction across ticketing, merch, concessions, streaming, social media, app usage, and loyalty. Intelligence segments fans not just by what they have purchased, but by how they engage, how often, and how their behavior is trending.
Show me fans with high digital engagement but zero ticket purchases this season
Which fan segments have the highest churn risk in the next 90 days?
Dynamic Revenue Optimization
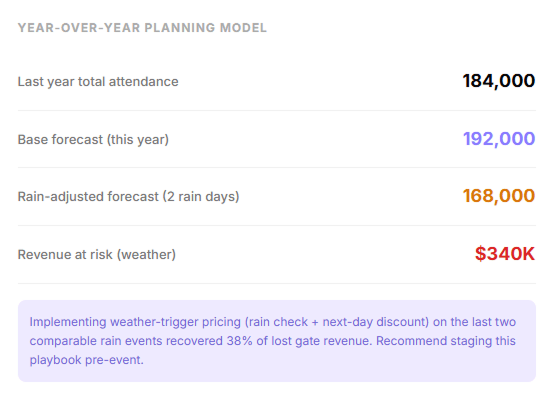
Optimize revenue across every channel: ticket pricing by section and game, concession staffing and menu pricing, merchandise timing and personalization, and digital content monetization. Intelligence reads demand signals from ticket velocity, social sentiment, weather, opponent draw, broadcast schedules, and historical patterns to recommend pricing and promotional decisions in real time.
Saturday's game is at 72% sold. What should we adjust in the next 48 hours?
What is the revenue difference between a 90% sellout and a 98% sellout for this matchup?
Loyalty and Lifetime Fan Value
Build a loyalty program that recognizes the full spectrum of fandom, not just purchases. Intelligence scores fans on engagement depth across every channel: attending games, streaming, sharing content, influencing others, purchasing merch, and participating in community events.
Which fans have the highest engagement scores but lowest loyalty tier?
What does the path from casual fan to season ticket holder look like in our data?
Gameday Operations
Optimize every operational decision on gameday: concession staffing based on predicted demand by section, gate flow management, parking lot sequencing, in-seat ordering prompts, and real-time crowd density monitoring. Intelligence connects pre-game ticket data to in-venue behavior, so you know what to expect before gates open and can adjust in real time once the crowd arrives.
Gate B is 40% above normal. What does that mean for Section 200 concessions?
What is the concession staffing plan for tonight based on ticket mix?
Intelligence that adapts to where you are in the calendar
Different questions in the off-season than on gameday. Intelligence shifts its focus to match where you are in the competitive and commercial cycle.
Every department gets an AI partner that sees the full fan picture
Not a dashboard that only shows in-venue data. An AI that connects every fan interaction, physical and digital, into a single intelligence layer.

Finance
Season revenue projections, per-cap modeling, and budget variance analysis grounded in daily operational data’s.
Finance
Executive Leadership
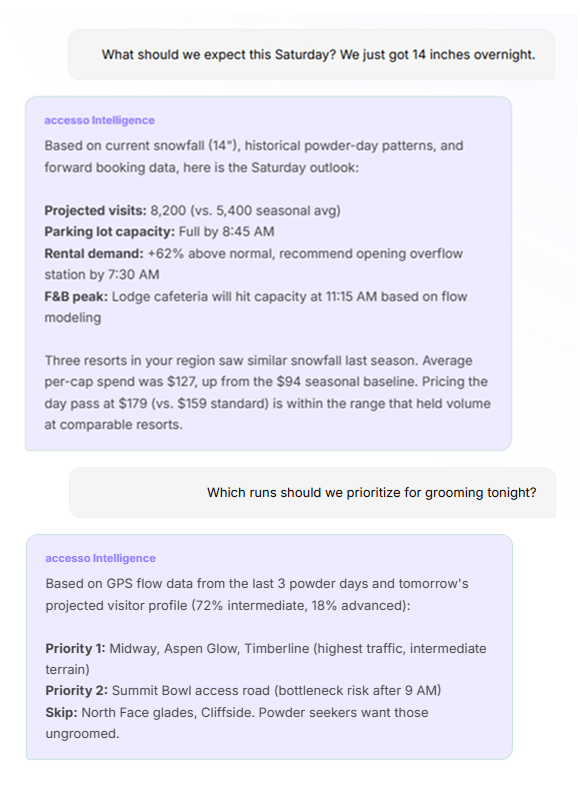
Hourly staffing models, lift queue predictions, rental demand curves, and grooming prioritization tied to tomorrow's forecast.
Executive Leadership
Marketing
Channel attribution, campaign timing, and pricing promotions based on what actually moves midweek and shoulder-season visits.
Marketing
Operations
Board-ready season summaries, competitive benchmarking, and scenario planning that pulls from every data source in the resort.
Operations
Guest Experience
Unified sentiment from Google, TripAdvisor, surveys, and NPS. Know what guests loved and where they got frustrated, by touchpoint.
Guest Experience
F&B and Retail
Predict lodge cafeteria volume, optimize menu mix by weather and crowd type, and catch inventory gaps before the weekend rush.
F&B and Retail
.png)
A data rich environment – which helps craft and drive what the visitor experience is going to be – means we’re more effective in enabling our visitors to enjoy their time in the museum.

In this uncertain environment, we are using Ask for insights into future admissions trends to project financial impacts and offer actionable strategies. Drawing on historical sales data and patterns in visitor reviews, it delivered a clear projection and actionable strategies to protect revenue and preserve the guest experience.
.png)
This is a real game changer for this industry. You honestly take data for granted when you work in other spaces… we’d spend so much time trying to manually sort this out – to be able to get the efficiencies from a data platform.
Connects to the systems your resort already runs
Pre-built connectors for the platforms ski resorts depend on. Most integrations go live in days, not months.

What would you ask your mountain if it could answer back?
Join the resorts building smarter operations with AI that understands ski.