Built for flexibility, built for your team
No code queries
Use our AI Query Assist to turn your words into data query.
Export to PDF/Excel
Share reports in any format your team needs.
Benchmark Comparisons
See how you compare to similar venues.
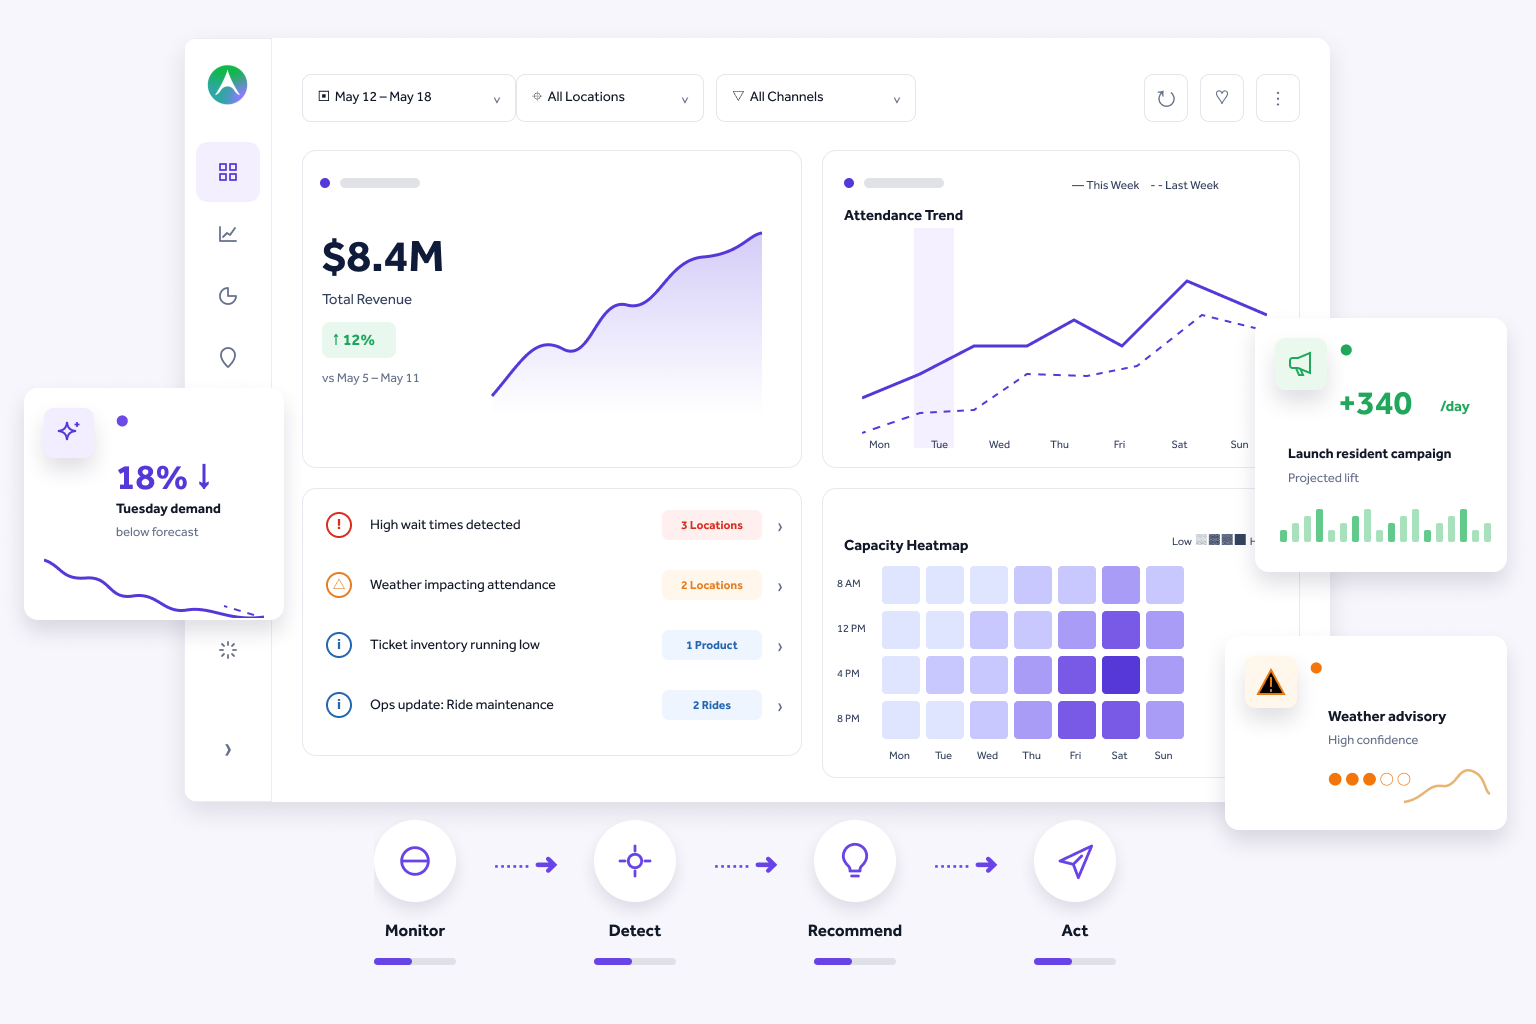
Beautiful, dynamic dashboards and automated reports built for the visitor economy. From daily ops snapshots to board-ready analytics, your data, visualized the way you need it.
Start with thousands of visualizations for attendance, revenue, guest satisfaction, F&B, retail, membership, and more. Work with dashboard templates, or point and click to design your own.
Live dashboards that update in real-time. See current capacity, queue times, transaction velocity, and weather impact as they happen. The cockpit view for your daily operations.
Schedule daily, weekly, or monthly reports delivered to any inbox. Board packs, department summaries, KPI scorecards that present then slice and dice data in any way.
ML-powered forecasting layered into every dashboard. See not just what happened, but what's coming. Attendance predictions, revenue projections, and demand curves — all with confidence intervals.
Use our AI Query Assist to turn your words into data query.
Share reports in any format your team needs.
See how you compare to similar venues.
.png)
A data rich environment – which helps craft and drive what the visitor experience is going to be – means we’re more effective in enabling our visitors to enjoy their time in the museum.

In this uncertain environment, we are using Ask for insights into future admissions trends to project financial impacts and offer actionable strategies. Drawing on historical sales data and patterns in visitor reviews, it delivered a clear projection and actionable strategies to protect revenue and preserve the guest experience.
.png)
This is a real game changer for this industry. You honestly take data for granted when you work in other spaces… we’d spend so much time trying to manually sort this out – to be able to get the efficiencies from a data platform.
Live dashboards that help you lead with confidence.