
Turn weather risk into revenue certainty
Your season is short, your weather is unpredictable, and every open hour matters. accesso Intelligence gives water park operators an AI that understands capacity, weather dependency, and the compressed economics of a summer season.

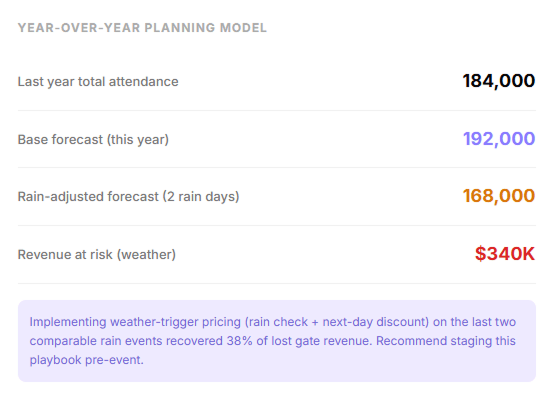
You get 100 operating days to make a full year's revenue. Most of them depend on the weather.
Water parks live and die by a compressed season. A single rained-out Saturday can mean six figures in lost revenue. But the bigger problem is what happens on the good days: maxed-out capacity, undertrained seasonal staff, cabana inventory sitting empty while guests wait in line for slides they could have skipped.
Weather dependency
A 30% rain forecast on Saturday morning triggers a cascade of staffing, food prep, and pricing decisions with no data to guide them
Capacity ceiling
On peak days, you hit max capacity by noon and turn guests away while underutilized attractions and time slots go unmanaged
Seasonal revenue compression
Static pricing treats a Tuesday in June the same as the Fourth of July. Cabana and tube rental revenue sits flat regardless of demand signals
Seasonal labor guesswork
90% seasonal workforce means you are always either overstaffed on slow days or scrambling on peak days, with no model in between
Ask your water park anything. Get answers that know the season.
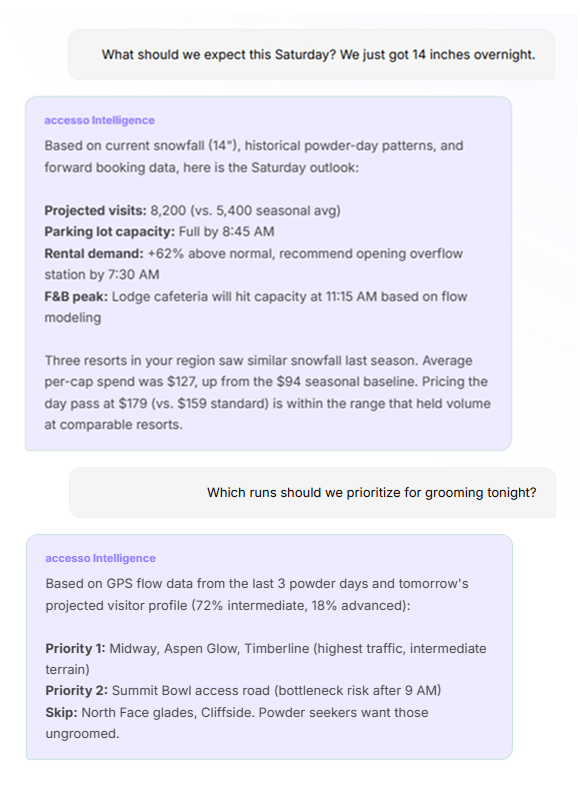
accesso Intelligence connects to your ticketing, POS, weather feeds, cabana reservations, and labor systems. It understands what a 95-degree Saturday means for lazy river capacity, tube rental demand, and how many lifeguards you actually need.
Every answer draws from your live data: gate scans, wristband taps, POS transactions, weather forecasts, attraction wait times, and guest feedback. No pre-built reports. Just ask.
Intelligence for every part of the park
From the wave pool to the cabana row, every decision gets sharper.
Weather-Adjusted Attendance Forecasting
Predict daily and hourly attendance factoring in temperature, precipitation probability, humidity, UV index, and wind. Know whether Saturday is a 9,000-guest day or a 4,000-guest day before you schedule a single lifeguard.
Forecast hourly arrivals for Martin Luther King weekend
How does a 6-inch snowfall on Thursday affect Saturday visits?
Cabana and Premium Revenue Optimization
Dynamically price cabanas, tubes, lockers, and premium experiences based on demand signals, weather, and day-of-week patterns. Intelligence identifies which inventory is underpriced on peak days and which sits empty when it should be discounted to fill.
What should we price Presidents Day weekend passes at?
Show me the price sensitivity curve for midweek day passes
Capacity and Flow Management
Model how guests move through the park by hour, tracking wave pool cycles, slide throughput, lazy river density, and splash pad crowding. Intelligence predicts where capacity bottlenecks form and recommends flow interventions before guests start leaving.
Generate a staffing plan for the rental shop this weekend
Where did we over-staff last month and by how many hours?
Seasonal Labor Optimization
Build staffing plans that flex with weather and demand instead of fixed schedules. Intelligence models lifeguard rotations, F&B shifts, and guest services coverage hour by hour, accounting for weather changes, attendance forecasts, and certification requirements.
Compare first-time visitor sentiment to season pass holders
What are guests saying about the lodge food this season?
Intelligence for every phase of the water park season
The season may be short, but the decisions that shape it happen year-round. Intelligence supports every phase from pre-season planning through off-season analysis.
Every team gets an AI partner that speaks water park
Not a generic dashboard. An AI that understands the difference between a 96-degree Saturday and a 78-degree overcast Tuesday, and what each means for your department.

Finance
Season revenue projections, per-cap modeling, and budget variance analysis grounded in daily operational data’s.
Finance
Executive Leadership
Hourly staffing models, lift queue predictions, rental demand curves, and grooming prioritization tied to tomorrow's forecast.
Executive Leadership
Marketing
Channel attribution, campaign timing, and pricing promotions based on what actually moves midweek and shoulder-season visits.
Marketing
Operations
Board-ready season summaries, competitive benchmarking, and scenario planning that pulls from every data source in the resort.
Operations
Guest Experience
Unified sentiment from Google, TripAdvisor, surveys, and NPS. Know what guests loved and where they got frustrated, by touchpoint.
Guest Experience
F&B and Retail
Predict lodge cafeteria volume, optimize menu mix by weather and crowd type, and catch inventory gaps before the weekend rush.
F&B and Retail
.png)
A data rich environment – which helps craft and drive what the visitor experience is going to be – means we’re more effective in enabling our visitors to enjoy their time in the museum.

In this uncertain environment, we are using Ask for insights into future admissions trends to project financial impacts and offer actionable strategies. Drawing on historical sales data and patterns in visitor reviews, it delivered a clear projection and actionable strategies to protect revenue and preserve the guest experience.
.png)
This is a real game changer for this industry. You honestly take data for granted when you work in other spaces… we’d spend so much time trying to manually sort this out – to be able to get the efficiencies from a data platform.
Connects to the systems your resort already runs
Pre-built connectors for the platforms ski resorts depend on. Most integrations go live in days, not months.

What would you ask your mountain if it could answer back?
Join the resorts building smarter operations with AI that understands ski.